I've been beating my head against the wall trying to tie out data from the API to our UI performance reports to no avail. Whether I look at the Timeline data, the Aggregate (queue) data, or the Detailed Call Logs, I can't ever seem to get the same answer via the API that I see in the interface. Even going so far as looking at a single call (Session ID) and comparing that to the call details in the Performance Report, I see different durations in the API returned call data from what appears in the UI.
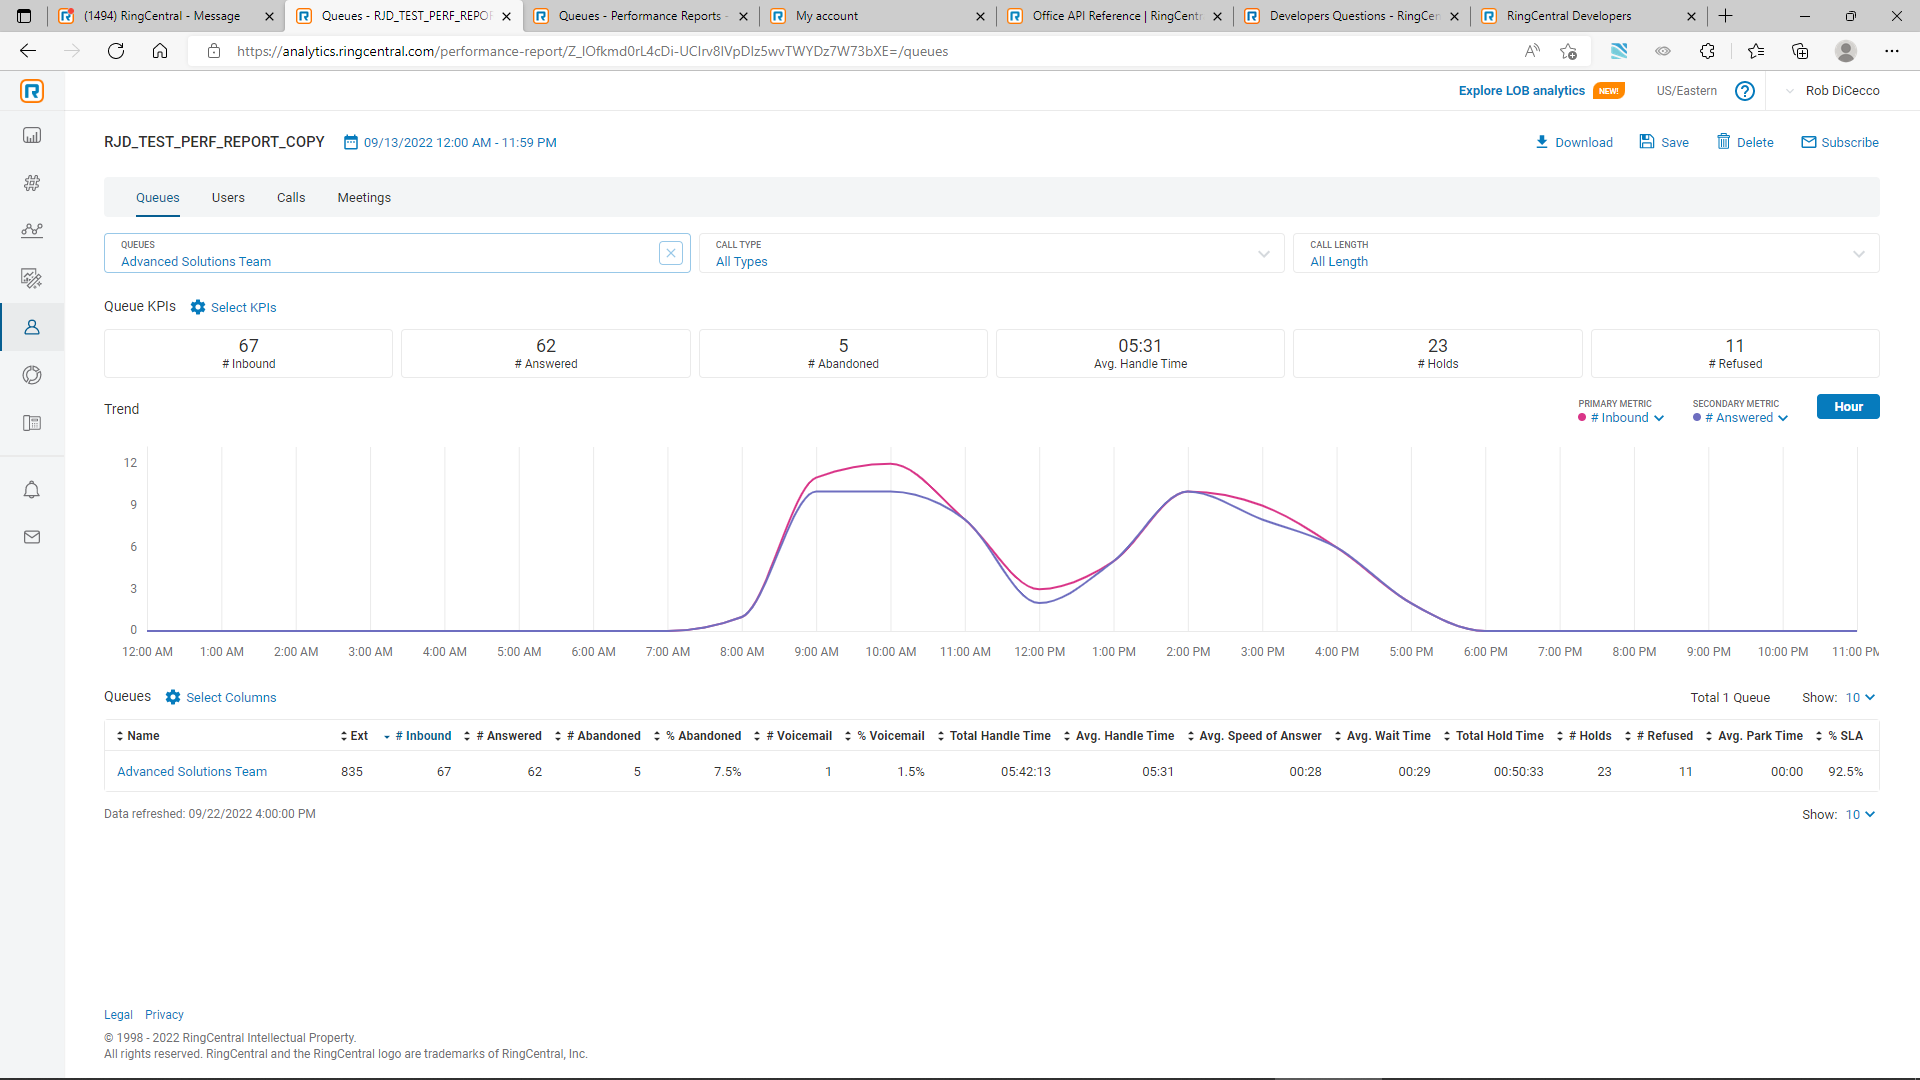
For this example, I'll focus on just the aggregation fetch, summarized at the queue level vs. the Queue view in the Performance Report for a single queue. Even putting aside duration, I don't see the same call counts. Filtering the Performance Report to 9/13 and focusing on the Advanced Solutions Team (one of our queues,) the Performance Report shows 67 inbound calls, 62 answered, with 5 abandons, 23 holds, 11 refused calls and a 92.5% Service Level. The API JSON return shows – 66 inbound calls, 62 answered calls (one thing that matches,) 14 abandoned calls, 23 calls placed on hold (the other item that matches,) and 62 calls within Service Level & 4 out of service level. Interestingly, 62 calls in SL out of 66 total, would be a 93.9% Service Level while 62 calls within Service Level out of the total shown in the UI of 67 would in fact be a 92.5% service level.
I've included a screenshot of the UI Performance Report I'm using below. The API call and the relevant portion of the JSON response are below as well. What on earth am I doing / interpreting wrong?
API Call -
URI - https://platform.ringcentral.com/analytics/calls/v1/accounts/~/aggregation/fetch?page=1&perPage=200
Body:
{
"grouping": {
"groupBy": "Queues"
},
"timeSettings": {
"timeRange": {
"timeFrom": "2022-09-14T04:00:00.000Z",
"timeTo": "2022-09-15T03:59:00.000Z"
},
"timeZone": "America/New_York"
},
"callFilters": {
"directions": [
"Inbound"
]
},
"responseOptions": {
"counters": {
"allCalls": {
"aggregationType": "Sum"
},
"callsByDirection": {
"aggregationType": "Sum"
},
"callsByOrigin": {
"aggregationType": "Sum"
},
"callsByResponse": {
"aggregationType": "Sum"
},
"callsSegments": {
"aggregationType": "Sum"
},
"callsByResult": {
"aggregationType": "Sum"
},
"callsByQueueSla": {
"aggregationType": "Sum"
},
"callsByActions": {
"aggregationType": "Sum"
},
"callsByType": {
"aggregationType": "Sum"
}
},
"timers": {
"allCallsDuration": {
"aggregationType": "Sum"
},
"callsDurationByDirection": {
"aggregationType": "Sum"
},
"callsDurationByOrigin": {
"aggregationType": "Sum"
},
"callsDurationByResponse": {
"aggregationType": "Sum"
},
"callsSegmentsDuration": {
"aggregationType": "Sum"
},
"callsDurationByResult": {
"aggregationType": "Sum"
},
"callsDurationByQueueSla": {
"aggregationType": "Sum"
},
"callsDurationByType": {
"aggregationType": "Sum"
}
}
}
}
JSON Response for the Advanced Solutions Team:
{
"key": "466272027",
"info": {
"extensionNumber": "835",
"name": "Advanced Solutions Team"
},
"timers": {
"allCalls": {
"valueType": "Seconds",
"values": 24336.79
},
"callsByDirection": {
"valueType": "Seconds",
"values": {
"inbound": 24336.79,
"outbound": 0
}
},
"callsByOrigin": {
"valueType": "Seconds",
"values": {
"internal": 817.415,
"external": 23519.375
}
},
"callsByResponse": {
"valueType": "Seconds",
"values": {
"answered": 24034.051,
"notAnswered": 302.739,
"connected": 0,
"notConnected": 0
}
},
"callsSegments": {
"valueType": "Seconds",
"values": {
"ringing": 3762.024,
"liveTalk": 14263.727,
"hold": 7451.89,
"park": 0,
"transfer": 212.3,
"ivrPrompt": 0,
"voicemail": 43.445,
"vmGreeting": 11.307,
"setup": 8.798
}
},
"callsByResult": {
"valueType": "Seconds",
"values": {
"completed": 19045.405,
"abandoned": 5040.912,
"voicemail": 250.473,
"missed": 0,
"accepted": 0,
"unknown": 0
}
},
"callsByQueueSla": {
"valueType": "Seconds",
"values": {
"inSla": 24034.051,
"outOfSla": 302.739
}
},
"callsByType": {
"valueType": "Seconds",
"values": {
"direct": 0,
"fromQueue": 20188.136,
"parkRetrieval": 0,
"transferred": 4148.654,
"outbound": 0
}
}
},
"counters": {
"allCalls": {
"valueType": "Instances",
"values": 66
},
"callsByDirection": {
"valueType": "Instances",
"values": {
"inbound": 66,
"outbound": 0
}
},
"callsByOrigin": {
"valueType": "Instances",
"values": {
"internal": 3,
"external": 63
}
},
"callsByResponse": {
"valueType": "Instances",
"values": {
"answered": 62,
"notAnswered": 4,
"connected": 0,
"notConnected": 0
}
},
"callsSegments": {
"valueType": "Instances",
"values": {
"ringing": 144,
"liveTalk": 62,
"hold": 23,
"park": 0,
"transfer": 11,
"ivrPrompt": 0,
"voicemail": 1,
"vmGreeting": 1,
"setup": 14
}
},
"callsByResult": {
"valueType": "Instances",
"values": {
"completed": 51,
"abandoned": 14,
"voicemail": 1,
"missed": 0,
"accepted": 0,
"unknown": 0
}
},
"callsActions": {
"valueType": "Instances",
"values": {
"parkOn": 0,
"parkOff": 0,
"holdOn": 14,
"holdOff": 0,
"blindTransfer": 0,
"warmTransfer": 8,
"dtmfTransfer": 0
}
},
"callsByQueueSla": {
"valueType": "Instances",
"values": {
"inSla": 62,
"outOfSla": 4
}
},
"callsByType": {
"valueType": "Instances",
"values": {
"direct": 0,
"fromQueue": 58,
"parkRetrieval": 0,
"transferred": 8,
"outbound": 0
}
}
}
}