
I want to get matching numbers in analytics api (python) and performance reports on the web, but they are different.
Can you take a look and tell me what I am doing wrong?
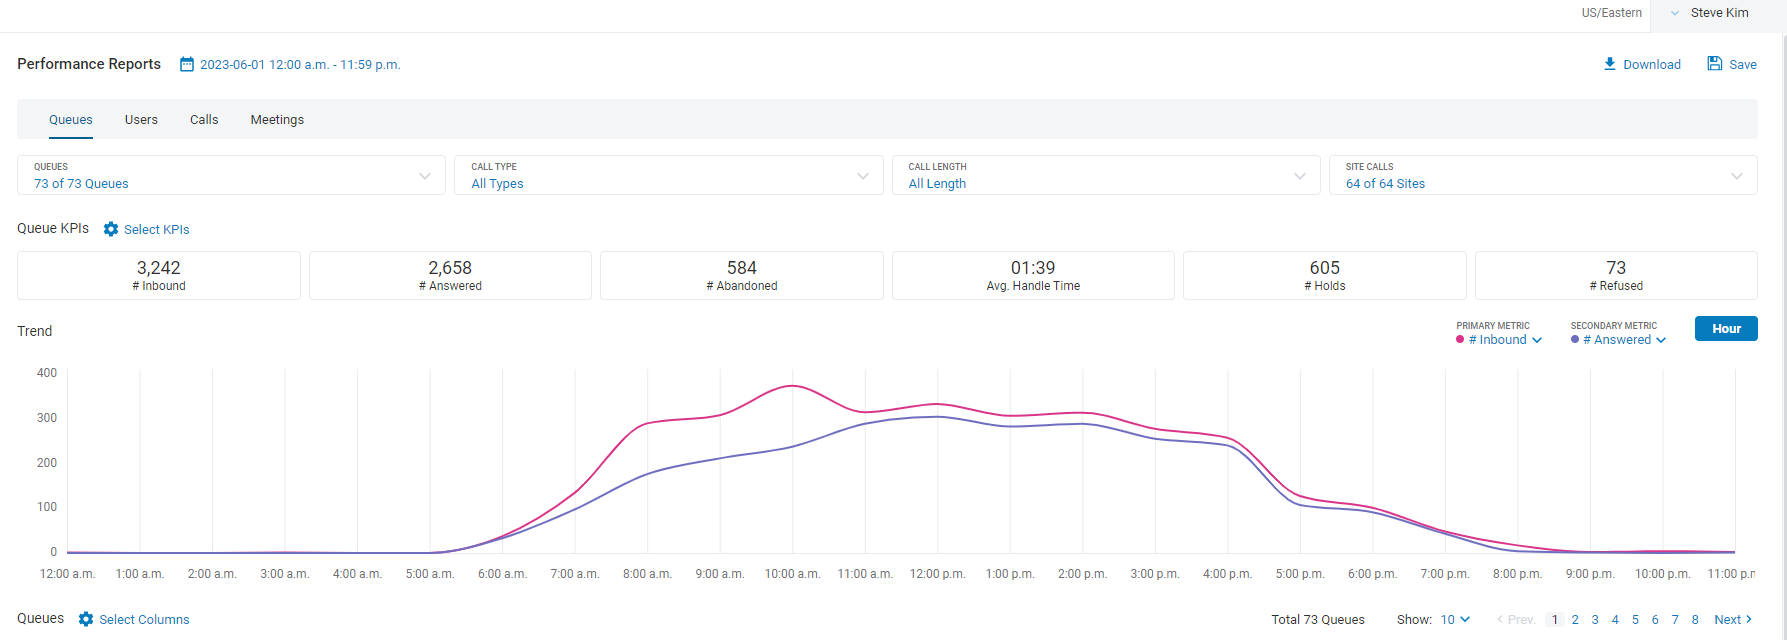
Web performance report shows 3,242 inbound calls as per below picture
And then to get API result using python, I first followed script as per this page: RingCentral Line of Business Analytics APIs Quick Start
Below is the parameters that I passed to the api call. 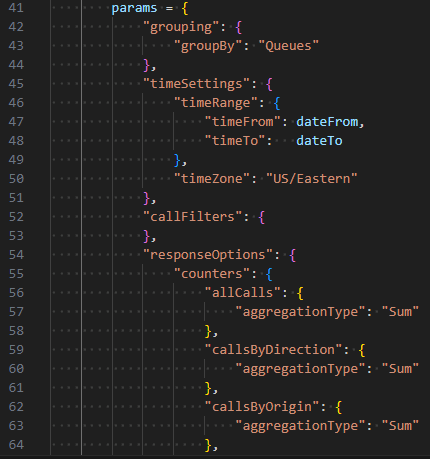
Regarding the "dateFrom" and "dateTo", I tried 48 different date/times:
(To try all possible time offsets that I can think of)
Here is the result of the 48 different tries. There is no inbound call count of 3,242 anywhere.
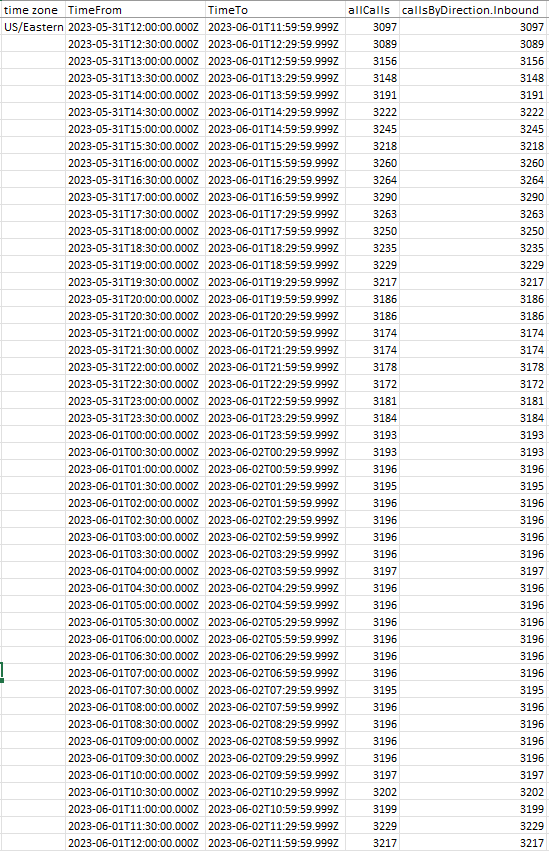
What am I doing wrong?

I notice the same issue. Let me check with the team to see how they convert and set the time. I think it's an issue in the Analytics dashboard engine. So I trust more the response from the API.

@Steve Kim, there were some issues with the dev ticket that was opened earlier, can you please submit a new ticket below for further investigation with your most recent RC Request Id, let me know the ticket number after you are done submitting.
https://developer.ringcentral.com/support/create-case

I found out that the API does not convert the timeFrom and timeTo from UTC to your specified time zone. So you have to convert the time accordingly.
Since you are in the US/Eastern time zone, can you try this "timeFrom" and "timeTo" format to read your analytics data for the same period of time set in the Analytics dashboard for:
Start date: 05/31/2023 / From: 12:00AM
End date: 06/01/2023 / To: 11:59PM
timeFrom: "2023-05-31T00:00:00-05:00",
timeTo: "2023-06-01T23:59:59-05:00"
Hi Phong,
I have already tried all of the time differences from -12:00 to +12:00 using the analytics API (you can see in the excel table picture in original request)
None of the analytics API results matched to the analytics web.
Can you provide me with the account id and the user extension id.
Checking with the team, they say that the Analytics dashboard app uses the user regional settings/timezone, of the user who logged in the app to get the offset time and convert the selected date/time range to UTC time using that offset.
When I tried that on my own account, I got the same result. Otherwise, I also got the discrepancy.
Where can I find the information that you are asking for?
Well, give me the account main company number and the name of the user instead. And give me again the exact date/time you selected from the the Analytics dashboard. Or, better if you submit a dev support ticket and provided the info asked above if you don't want to reveal your production account info here.
The main company number is (877) 329-6531 and the name of the user is Steve Kim.
The time that was used in the Analytics Dashboard was 2023-06-01 12:00 am - 11:59 pm US/Eastern. (found in the picture attached in the original post.)
I submitted a dev support ticket as well on either July 20 (Thu) or 21 (Fri) but didn't receive any replies.
Can you check your timezone setting in your account and convert the time using that timezone and call the API with just that timeFrom/timeTo and share with me the result plus the rcrequestid.
I don't have time to look into your timezone settings and match it with one of the test results on that long list in the attached image.
Also provide me with the support case number.
The timezone setting is US/Eastern.
Here's the result API using -5:00 and -4:00 (I will provide two because my time zone is affect by the summer time)
And what is rcRequestId?
| TimeFrom | TimeTo | sum of allCalls (grouped by Queues) |
| 2023-06-01T00:00:00.000-05:00 | 2023-06-01T23:59:59.999-05:00 | 3229 |
| 2023-06-01T00:00:00.000-04:00 | 2023-06-01T23:59:59.999-04:00 | 3186 |
The support case number sent to dev support team is 00D80aRUX._500Hr1XDlMN. I got a reply this morning.
I notify the support team too. They are working on it.
Stay tuned!
Thanks for looking into this case.
In the analytics web page, I found out that there are three filters that have same name as the API - 'Queues', 'Users', and 'Company Numbers'
None of the three groupings had any matching numbers when I ran a similar test as my post.
Also, the difference for 'Users' grouping is very significant, almost three times as much total calls from API (~18,000 total calls on Jun 1) vs performance report from web (~6,000 total calls on Jun 1)
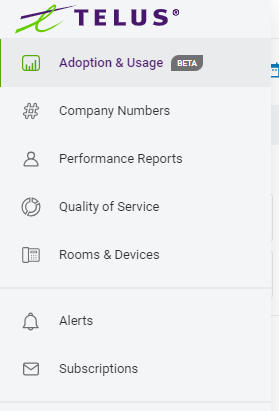
Below is the list that my account has. I don't have the LOB Analytics, but the Adoption&Usage is in BETA so I used it to compare some numbers. The result was close, but still not matching.
Ouches! The LOB Analytics is only available for RC brand right now. The team is still working on the discrepancy between the API and the app dashboard. As for me, I trust the result from the API more as I think the app might modify the date/time range incorrectly. But I have to wait for their investigation.
Hi, just wanted to check on how the investigation is going.
The Performance report has some adjustments and it has some legacy. I will check with the team to see how they are going to deal with that.
Try the LOB Analytics. That will give you closer result to the API response. But it still shows discrepancy between that and the API result which is being investigated)
A new Community is coming to RingCentral!
Posts are currently read-only as we transition into our new platform.We thank you for your patience
during this downtime.
Try Workflow Builder
Did you know you can easily automate tasks like responding to SMS, team messages, and more? Plus it's included with RingCentral Video and RingEX plans!Try RingCentral Workflow Builder